https://public.tableau.com/app/profile/.62312393/viz/GA4DataDashboard/1?publish=yes

개요
Data Source : 본인 티스토리 블로그를 방문한 유저 의 GA4 행동 데이터
(수집 과정 https://sunchol21.tistory.com/1684)
Data Source: GA4 behavioral data of users who visited their Tistory blog (Collection process https://sunchol21.tistory.com/1684)
구현내역 :
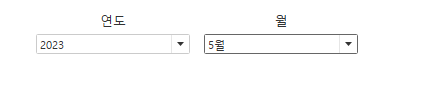
필터 - 기간 설정
Implementation details:
Filter - set time period
데이터 원본 - Active Users,, screen page views, Session, Engaged Session
계산된 필드 활용 - view per user, view per Session, New users, Bounce Rate
Data sources - Active Users,, screen page views, Session, Engaged Session
Utilize calculated fields - view per user, view per Session, New users, Bounce Rate
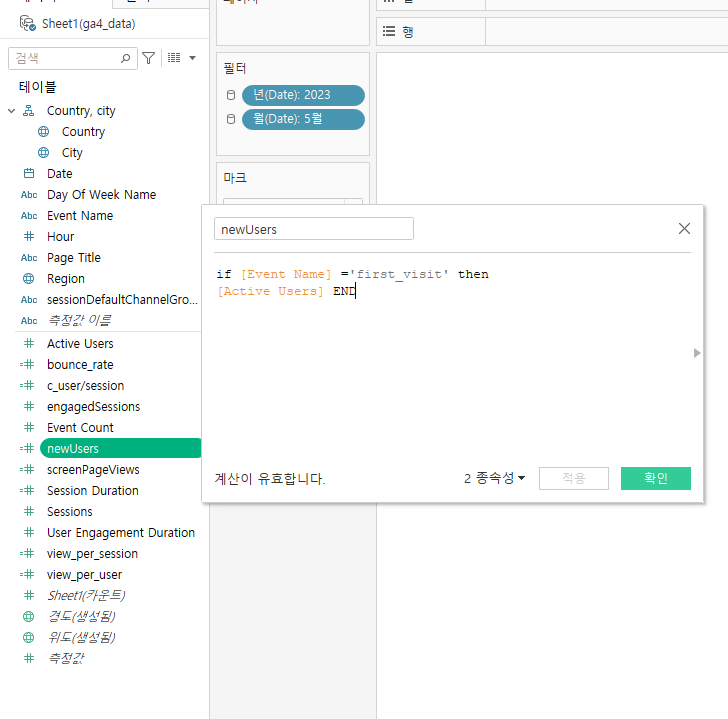
계산된 필드를 활용하지 않고 API호출시에 Metric 으로 가져올수도 있으나 그렇게 되면 데이터가 sparse matrix 형태를 띌것을 우려해 태블로 내에서 계산된 필드 활용함.
It can be imported as a metric when calling the API without using the calculated field, but in case of concern that the data will take the form of a sparse matrix, the calculated field is used in Tableau.
일자별 유저수, 세션수
Number of users per day, number of sessions
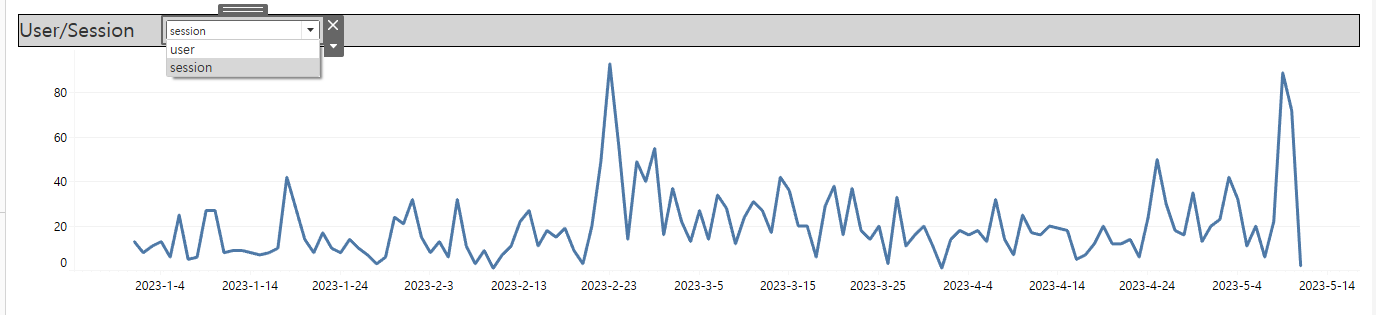
매개변수를 활용해 user와 session을 정해서 볼 수 있음.
User and session can be set and viewed using parameters.
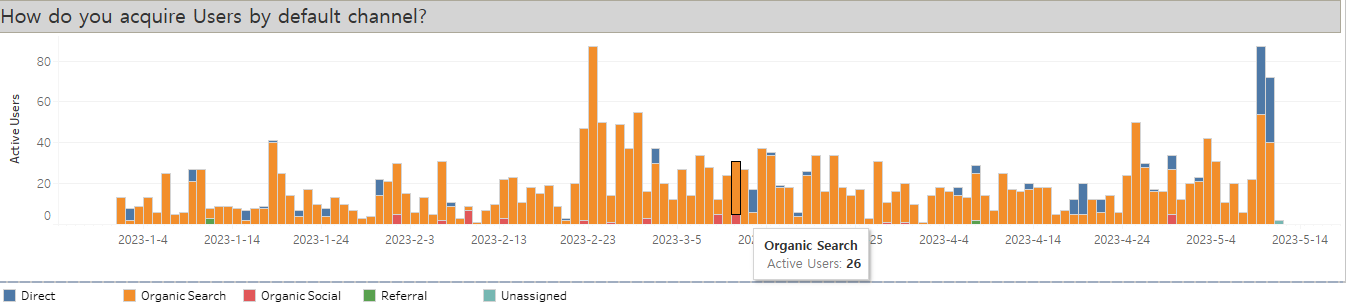
채널별 유입 유저수
Number of Inbound Users by Channel
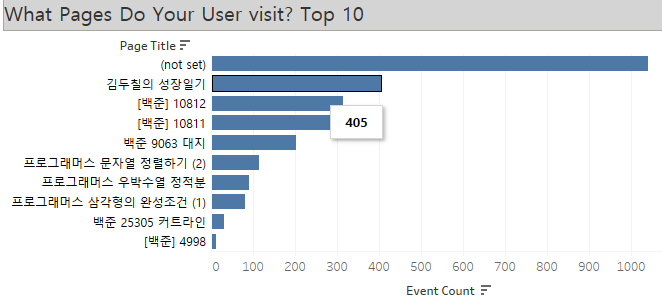
페이지별 이벤트수 Top 10
Top 10 number of events per page
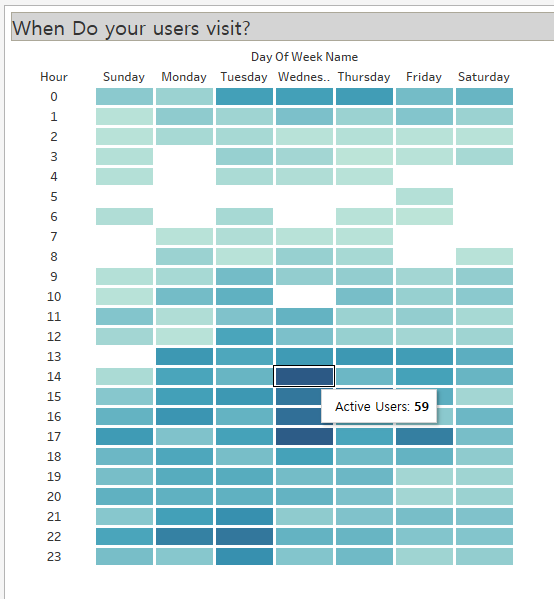
시간/요일별 유저수(히트맵)
Number of users by time/day (heat map)
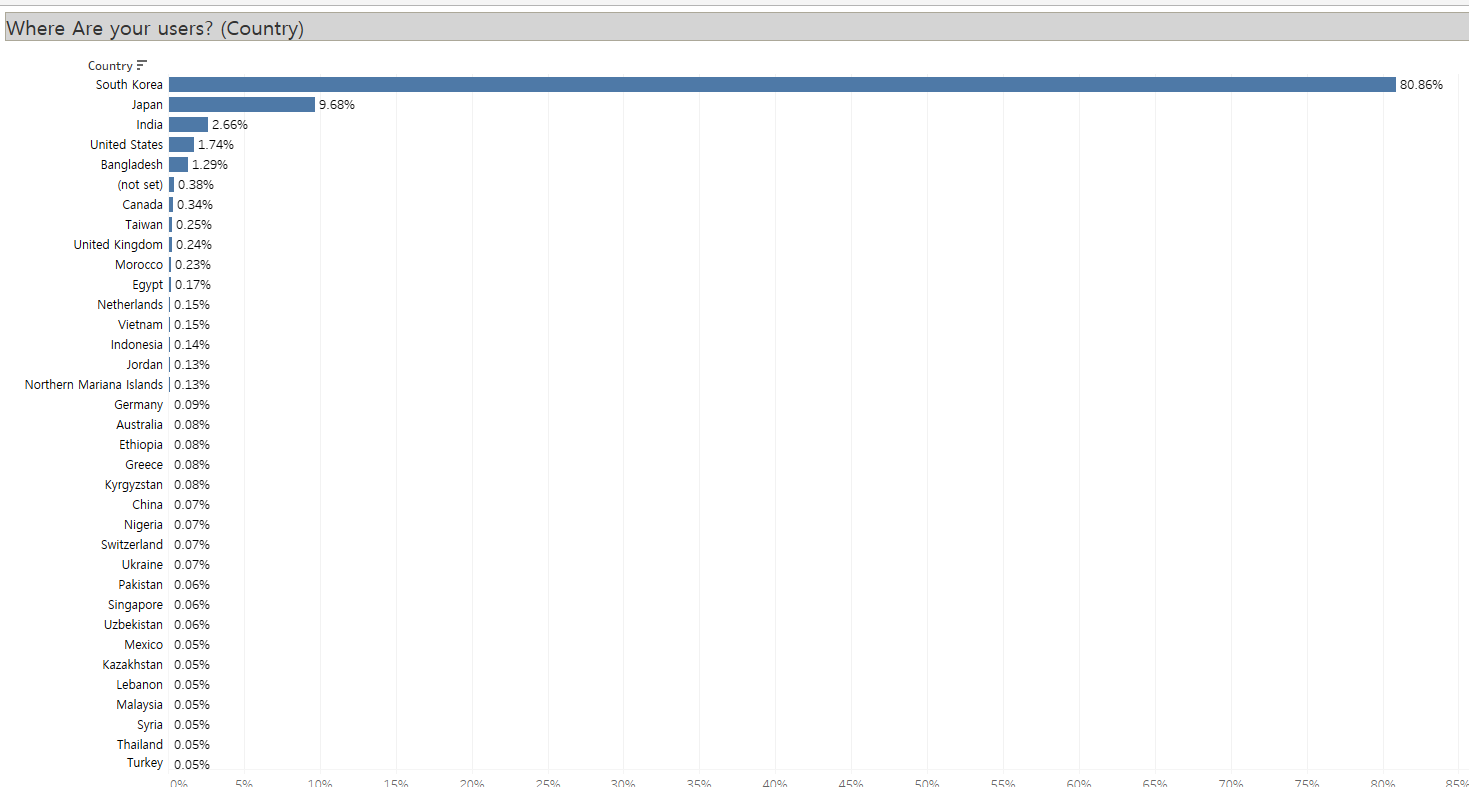
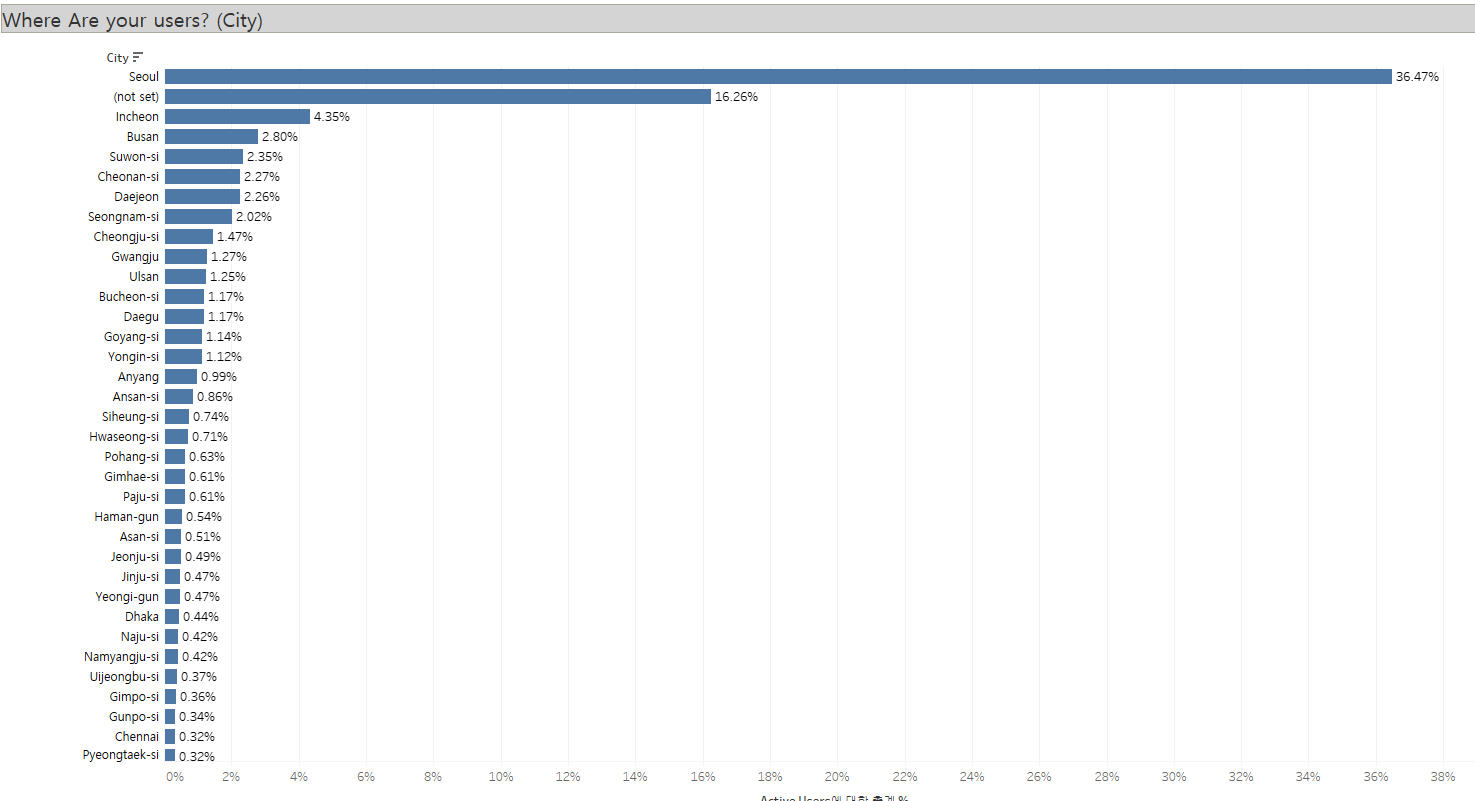
나라별/도시별 유저수
Number of users by country/city
'회고' 카테고리의 다른 글
| 2023 09 회고.. (0) | 2023.10.18 |
|---|---|
| 23년 3월.. (0) | 2023.04.04 |
| 카카오 데이터 센터의 건.. (0) | 2022.10.19 |
| GA 도입 3일차의 건 (0) | 2022.09.29 |


댓글